TLDR: A metric definition is more than a formula. There is a standard, seven-field way to write one so two people compute the identical number. The part that standard skips, and the part this series cares about, is an honest note of what the number does not yet capture. The audit tells you what is broken. The definition records what you can trust given that, and it stays correct even while the numbers are still wrong.
Click to discuss this article with your favourite AI
By now you have a list of decisions worth making, a map of what the site lets people do and an audit telling you which numbers you can trust and which you cannot. The natural next move is to start reporting. Do not, not yet. There is a small, unglamorous step in between that decides whether the reporting means the same thing to two people, and it is writing down what each metric actually is.
This sounds like bureaucracy. It is the opposite. It is what stops the Monday meeting where marketing reports a 3% conversion rate and finance reports 2.1%, and the first half hour goes on working out that one counted sessions and the other counted users. And there is one field in a good definition that almost everyone leaves off, the one that decides whether you can trust the number at all. That is where this is going.
A definition is not a formula, it is a formula plus its caveats
Ask three people what “conversion rate” means and you will get three answers. Purchases over sessions. Purchasing users over users. Orders over visits. They are different numbers that tell different stories, and if your team has never written down which one it means, everyone is quietly using their own.
There is a standard way to stop that, a metric definition, sometimes called a metric anatomy. Seven fields that, once filled in, let anyone calculate the identical number from the definition alone. Here it is on a real one, the rate of customers who get from starting checkout to completing the shipping step, on a site I worked on.
| Field | This metric |
|---|---|
| Name | Checkout to Shipping Rate |
| Numerator | Distinct users who fired add_shipping_info |
| Denominator | Distinct users who fired begin_checkout |
| Time window | Rolling 90 days |
| Inclusions | All devices, all traffic channels |
| Exclusions | Internal and staff traffic |
| Rationale | How many checkout starters reach the shipping step, a stand-in for reaching payment |
This is the two-person test: hand that to any two analysts, or to an analyst and an AI, and they return the same 50.2%. No argument about denominators, no quietly different numbers. It is the boring, foundational half of a definition, and skipping it is why teams end up fighting about figures that were never actually defined.
But the metric definition has a blind spot, and it is the half this series is really about.
The number can be defined perfectly and still be a proxy
Notice what those seven fields do not ask. They pin down how to calculate the number. They say nothing about whether the tracking underneath it is any good. And the audit just told us it is not.
For this exact metric, the audit found two things. GA4 could not see the payment step, because the platform loaded it as a fragment the analytics never registered as a page. And customers paying by express methods like Afterpay skipped the shipping step on their way to an offsite payment. So 50.2% is correctly defined and quietly overstated. Two analysts still agree on it. They are just both a little wrong about what it means.
So I add one field the standard anatomy leaves out, and here it is the one that matters most: known limitations.
Known limitations: A proxy for reaching payment, not a true measure of it. GA4 cannot see the payment step, and express payment methods like Afterpay skip the shipping step, so this rate reads slightly high. It becomes a true measurement once the payment page fires its own event, which is queued in the fix plan.
The formula did not change. What changed is what you are allowed to conclude from the number, and that now travels with it. Without the limitation, anyone reading 50.2% takes it as the truth. With it, they read it as a proxy that runs a little high until the tracking is fixed. Same number, same two analysts, and only the ones who can see the limitation are actually right.
The audit tells you what is broken, the metric definition tells you what you can trust
This is the cleanest way I can put the relationship between the two steps.
The audit is a list of what is wrong. The metric definition is where you translate “wrong” into “here is how far you can trust this specific number until it is fixed.” A broken tag does not make a metric meaningless. It makes it a number with a known asterisk, and a documented asterisk is something a person or a model can reason around. An undocumented one is a landmine.
That reframing matters, because it stops teams from throwing out a metric the moment they learn it is imperfect. Almost every metric is imperfect. So when someone tells me a number is wrong, the first thing I check is not the formula, it is whether anyone has written down how it is wrong. Nine times out of ten they have not, and that is the actual problem.
Definitions are versioned, not carved in stone
Because tracking improves, definitions move. When someone finally fixes the payment tracking, that shipping-step proxy becomes a real measurement, the caveat retires, and the number itself shifts. If you have not kept the history, that shift looks like a mystery, or worse, like a win someone takes credit for.
So you version them. I keep each metric definition with the date it was written, what it captures today and a note that it only becomes a true measure once the payment page fires its own event. When that fix lands, I date a new version and flag that the number will step up, so nobody six months later mistakes a tracking fix for a sudden jump in performance. The thresholds that decide what counts as a healthy number, a watch or an investigate work the same way. They can only be set honestly once you have clean data to base them on, and you will not have that until the fixes land. So you set them provisionally, firm them up later, and you say which is which.
The tree comes from here too
One more thing this step produces, and it pays off twice later. Each of the metrics that matters most gets decomposed into the levers underneath it. Revenue splits into users, conversion rate and average order value. Conversion rate splits into the funnel steps. Average order value splits into basket size and price per item, the same decomposition that reframed a vague AOV request back at the start of all this.
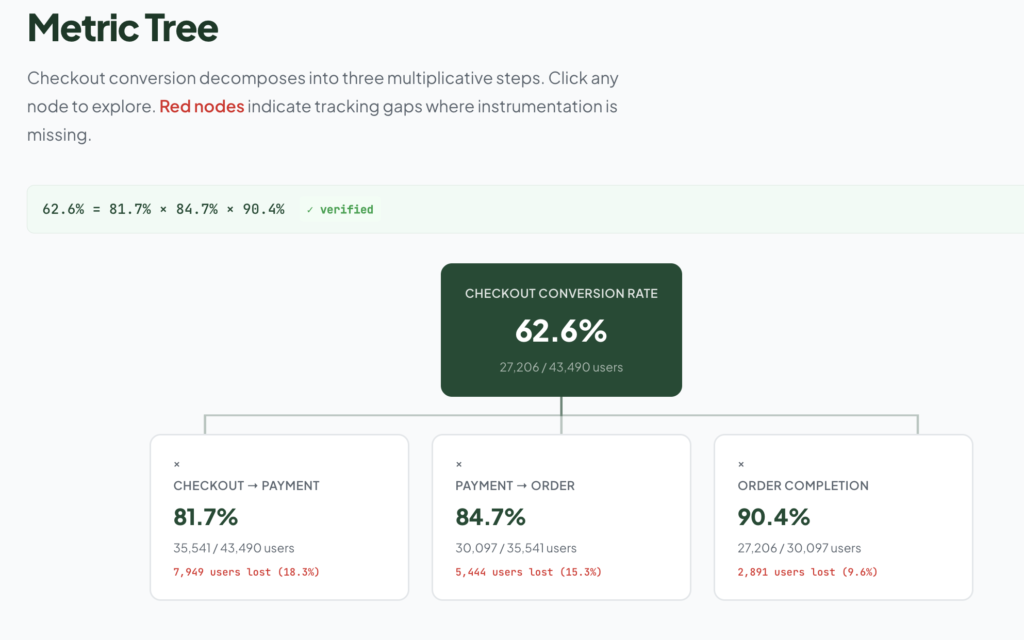
That decomposition is not decoration. It is the diagnostic map. When revenue moves, the tree tells you which lever moved, and the definitions tell you whether that movement is real or an artefact of a number you already know you cannot fully trust. Hold that thought, because it becomes the reporting layer near the end of this series.
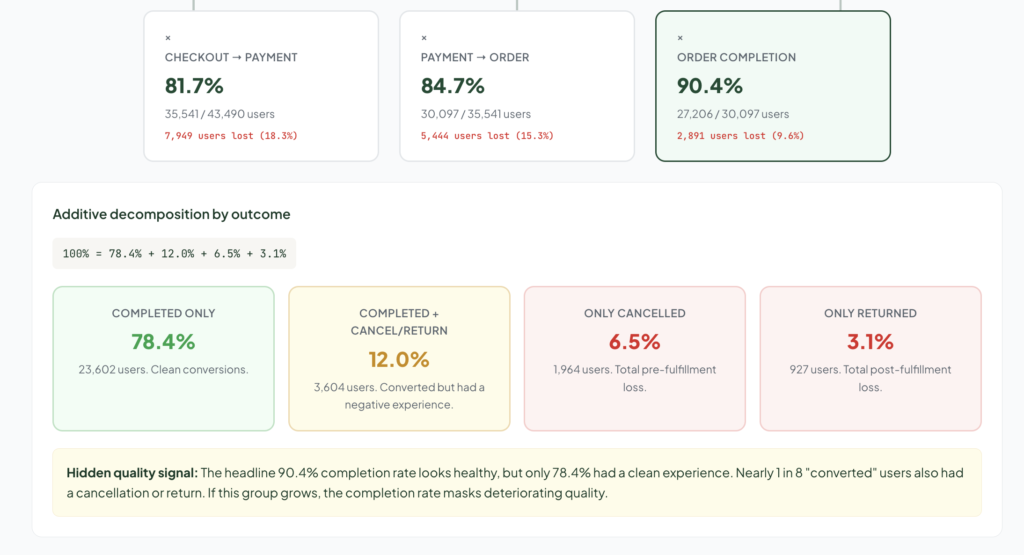
For now you have something quietly valuable: a set of metrics, each defined so anyone computes it the same way, each carrying an honest account of what it can and cannot tell you, each tied to a decision that needs it. Which throws the next step into sharp relief. You now know exactly what is broken and exactly what each break is costing you in trust, so you can stop fixing things at random and fix them in the order that actually helps. That is next.
Is your team all talking the same language?
If your team argues about what the numbers mean, or quietly disagrees without noticing, defining and documenting your metrics is the fix. It is unglamorous and it changes everything downstream. I do this with ecommerce businesses as part of building reporting they can trust.